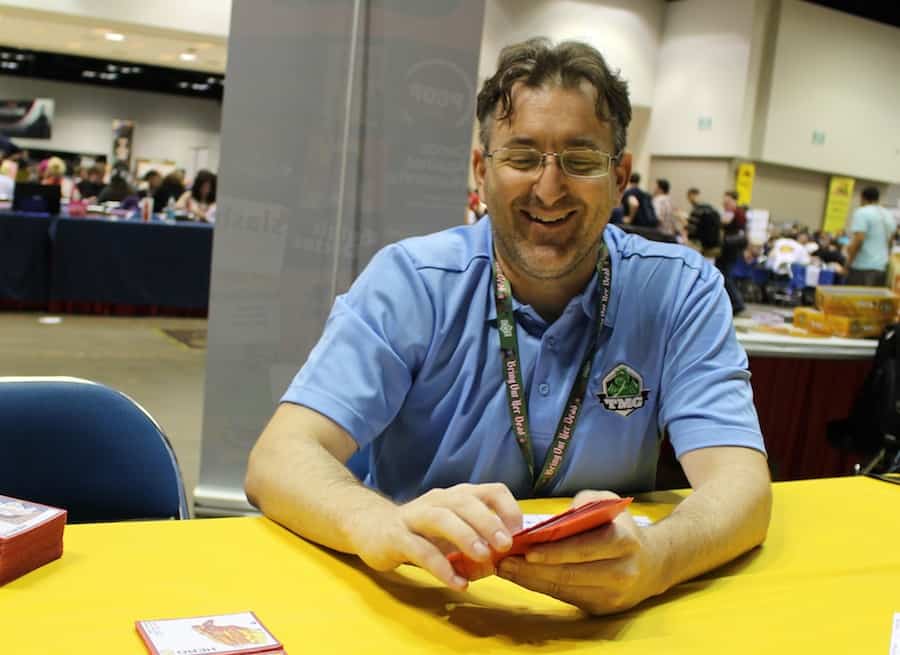
James Ernest explains the basics of probability theory as it applies to game design, using examples from casino games and tabletop games. This article is a preview of James Ernest’s design lecture at Gen Con 2014, “Probability for Game Designers: Basic Math.”

James Ernest is an eccentric game designer and the innovative mind behind Cheapass Games: a singular force of power in the tabletop world. For many years, Cheapass Games shipped bare-bones games in ziplock bags BYOD (bring your own dice). Later, many of those games became available as free, downloadable .pdf’s. Now, Cheapass Games runs highly successful Kickstarter campaigns, reviving classic Cheapass titles, as well as bringing new games to the masses.
James Ernest is interested in much more than taking all your money. He wants to help you make your games better. You might be surprised at how much meat there is in this article. Hidden beneath the surface of his humor-infused game designs, there are interlocking gears of mathematical precision. I met James Ernest after hearing his talk on “Volatility in Game Design” at Gencon in 2012, and that experience changed my life. I knew I wanted to be a designer, his talk helped me discover the kind of designer I wanted to be. If you have the chance, his lectures are not to be missed! – Luke Laurie

INTRODUCTION
Probability theory is essential to game design. We all have a rough grasp of it, but many new designers lack the tools to formally analyze even the simplest systems in their games. This article is an introduction to the formal theory.
Probability theory was invented by gamers. People wanted to understand the odds in games of chance. Pioneers included Gerolamo Cardano in the sixteenth century, and Pierre de Fermat and Blaise Pascal in the seventeenth century. This whole branch of mathematics grew up around gaming.

BASIC TOOLS
In probability theory, we talk about the “odds” of something happening, expressed as a number between 0% and 100% (or 0 and 1). If something has a 100% chance of happening, it will definitely happen. At 50%, it is equally likely to happen or not happen.
Part of this formalization requires asking specific questions. If I’m playing with a coin, what are my odds of flipping heads? Well, that depends on exactly what question you want to answer. If I only flip it once, we assume that the odds are 50%. But if I flip it all day, the odds of getting heads at least once are nearly 100%.
If you take all the different possible outcomes of a random event and add them together, the total will always be 100%. For example, excluding the “edge case” where a coin lands on its edge, the odds of flipping heads (50%) and the odds of flipping tails (50%) add up to 100%.
In two flips, there are four possible results, though they are often disguised as three. You can flip two heads, two tails, or one of each. “One of each” actually happens in two ways, so it’s twice as likely as the other two results. The full list of possibilities includes HH, TT, HT, and TH, each with a 25% chance.
![]()
EXERCISE: DICE ODDS
What are the odds of rolling a 6 on a 6-sided die? You should already know this, they are 1/6. This can be read as “one sixth” or “one in six,” and it’s also abut 16.7%.

How about the odds of rolling any other number or set of numbers on the d6? Each individual number is the same, 1/6. Because the results are mutually exclusive, you can add them together, so the odds of rolling a 4 or a 5 are 1/6 + 1/6, or 1/3.
You can also find odds of a result by subtracting the odds of the opposite result from 1. So, the odds of rolling anything except a 6 would be 1 – 1/6, or 5/6.
![]()
EXERCISE: CATCHING A PAIR
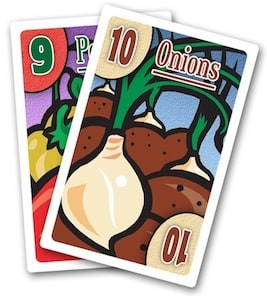
In the game Pairs, the goal is to avoid catching a pair (two cards of the same rank). The Pairs deck contains a triangular distribution of cards: 1 x 1, 2 x 2, 3 x 3, etc. up to 10 x 10. There are no other cards in the deck. This totals out to 55 cards. The question is: if you draw one card to a hand of (9,10), what are the odds of getting a pair?
For this exercise we will ignore all the other cards in play. There are 53 cards left in the deck, plus the (9,10) in your hand. Of the 53 cards, there are eight remaining 9’s and nine remaining 10’s. That makes 17 cards that give you a pair, out of 53 cards, for a probability of 17/53 = roughly 32%. (In the actual game you can see other cards, and get a better value of the odds by taking those out of consideration.)

SERIAL PROBABILITIES
The odds of several things happening together (or in sequence) can be determined by multiplying their individual odds. For example, the odds of flipping two heads in a row is 25%. This is 50% for the first flip, times 50% for the second flip. The odds of flipping three heads would be 50% x 50% x 50%, or 12.5%. These odds could also be expressed as 1/2, 1/4, 1/8, and so on.

Note that this type of analysis only works on future events. Once you have already flipped two heads, the odds of that having happened are 100%, and the odds of the next flip also being heads are 50%.
![]()
EXERCISE: WHAT ARE THE ODDS OF ROLLING A 5 OR HIGHER ON EACH OF 3D6?
Even if you roll the dice together, it can help to think of them as rolling one at a time. The odds of getting a 5 or 6 on the first die is 2/6 (or 1/3). The odds are 1/3 on each successive roll, for a result of 1/3 * 1/3 * 1/3 or 1/27.
![]()
EXERCISE: “ROLL SIX TIMES”
To win a game of “Roll Six Times” you have to roll a d10 six times. Each turn, you must roll higher than the current turn number. For example, on turn 3, you must roll a 4 or higher. If you ever roll below the turn number, you lose. How hard is it to win a game of “Roll Six Times”?
On turn 1, you have to roll a 2 or higher. This has odds of 9/10, or 90%. On turn 2, the odds reduce to 80%, and so on. To succeed on every turn the odds are (9/10) x (8/10) x (7/10) x (6/10) x (5/10) x (4/10), or about 6%.
![]()
EXERCISE
On your own, determine the smallest die for which “Roll 6 times” is winnable more than half the time.

MUTUALLY EXCLUSIVE RESULTS
We mentioned “mutually exclusive results” in an exercise above. Basically it just means that the two results can never happen at the same time. For example, you can’t get results of both heads and tails on the same flip. It can’t be “raining” and “not raining” at the same time.
What do non-exclusive results look like? Consider the odds of drawing “A club or an Ace.” There are 13 clubs and 4 aces, so if these results were mutually exclusive, there would be 17 ways to succeed. But one of the cards is both an Ace and a club, so we have to be careful not to count it twice. There are actually only 16 ways to succeed in this case.
In an example this small, it’s easy just to count the successes and the failures. But in a larger data set it’s not always easy to count all the possible results.
![]()
EXERCISE: NON-EXCLUSIVE RESULTS
On a roll of 2d10, what are the odds of rolling at least one 10? The phrase “at least one 10” actually includes three different sets of results: all versions 10-X, X-10, and 10-10. So there are a total of 19 ways to succeed. That’s 9 versions of 10-X, 9 versions of X-10, plus the single case of 10-10. The total number of possible rolls is 100 (10 x 10) so the odds of success are 19/100 or 19%.
Another way to solve this problem is to figure out the ways NOT to succeed, and then subtract that value from 1. If you were to fail at the “roll at least one 10” game, that would mean rolling no 10 on your first roll (90%) and no 10 on your second roll (90%). Succeeding at both of these requires the product of the individual probabilities, so the odds are 0.9 x 0.9 = 0.81. Subtracting the odds of failure from 100%, we get 19%, the same answer as above.

EQUIPROBABLE EVENTS
Probabilities are easier to figure when all possible results happen with the same frequency. For example, heads and tails are both 50%; each number on a d6 is equally likely at 1/6. But some events aren’t that simple; on 2d6, the odds of rolling a total of 2 are much lower than the odds of rolling a 7. That’s because there are many more ways to roll a 7 than to roll a 2.
To get a better picture of the odds, it’s sometimes helpful to break results down into larger lists of equiprobable results.
![]()
EXERCISE: THE ROBBER IN SETTLERS OF CATAN
How often does the robber move? At the start of each turn in Settlers of Catan, the active player rolls 2d6 to determine which regions produce resources. On a roll of 7, there is no production, and instead the robber is moved. So, the basic question is what are the odds of rolling a 7 on 2d6?

There are 36 possible rolls on 2d6: 6 options for each die, for a total of 36 possible rolls. Of these rolls, six add up to 7. They are (1,6), (2,5), (3,4), (4,3), (5,2), and (6,1). So the chance of rolling a total of 7 on 2d6 is 6/36, or 1/6. This means the robber will move, on average, once every six turns.

STATISTICALLY INDEPENDENT EVENTS
Events are “statistically independent” if the result of one has no effect on the results of the other. In general, this is how random events work. The chance of flipping heads is not affected by previous flips (or by the weather, the stars, or how much you really deeply need to flip heads).
However, in some situations the odds of a specific random event can be affected by the results of previous events. This happens when the randomizer is altered by the events, the best example of which is drawing cards from a deck. This type of game can create statistically dependent events.
For example, if you draw two cards from a poker deck, what are the odds of the second card being an Ace? (Compare this to the “rolling at least one 10” problem above). In this case, the odds of the first card being an Ace are simple, at 1/52. However, the odds for the second card depend on the result of the first.
If your first card is an Ace, the odds of the second card being an Ace are 3/51. Only three Aces remain in a deck of 51 cards. If your first card is not an Ace, the odds of the second card being an Ace are higher, at 4/51.
To find the odds of drawing at least one Ace in the first two cards, we can look at both paths and determine the odds of each one succeeding, then add those probabilities together for a final answer. In Path 1, where the first card is an Ace, we don’t care about the second card, because we have already succeeded. This result accounts for 4/52 of the games, or about 7.7%.
In Path 2, the first card is not an Ace, so we only win if the second card is an Ace. The odds of the first card NOT being an Ace (this is how we get into this path) are 48/52 or about 92.3%. From this point, the odds of drawing an Ace are 4/51, or about 7.8%.
To find the odds of succeeding on both steps of this path (remember, success on the first step of path 2 is defined as NOT drawing an Ace) we multiply the two probabilities together. This gives a result of 92.3% x 7.8%, or about 7.2%.
Because path 1 and path 2 are mutually exclusive (they begin with the mutually exclusive steps “draw an Ace” and “draw not an Ace”) we can add those probabilities together for the final result: 7.2% + 7.7% is about 14.9%.
As we described with d10s, a much simpler solution to the same problem would be to find the odds of drawing no Ace, and subtracting those odds from 1. The odds of drawing no ace are 48/52 for the first card, and 47/51 for the second. These multiply out to about 85.1%. Subtracting this from 100% yields the same result of 14.9%.
However, the more protracted analysis above is applicable in may game situations where solutions must be obtained on partial data. For example, in the middle of a hand of stud poker, the odds of certain cards appearing will be depend on what cards that have already been seen.

EXPECTED VALUE
Another useful concept in probability theory is “expected value.” It can be somewhat counterintuitive, since it’s based on average results and might not represent a possible result. It reflects the average performance of an experiment over an arbitrarily large number of trials.
For example, the expected value of a single d6 is the average of all equiprobable results (1, 2, 3, 4, 5, 6), or 3.5. There is no 3.5 on a d6, but if you rolled a d6 a million times and averaged the results, the value would come very close to 3.5.

Imagine a game where one player gets 7 points each turn, and the other rolls 2d6. Which side would you rather take? They both have the same expected value, but which is better? This is often a matter of personal taste (or it depends on the other game mechanics), and many similar examples of this type of decision exist in real games. It often is wise to give players options between such low- and high-volatility paths. Depending on other game mechanics, it might be more fair to give the players a running value of 6 points, 8 points, or something even farther from 7.
Expected value is useful in situations where the numeric values are aggregated, such as rolling for points in the example above, or tracking wins and losses in gambling. If you’re not using the die roll for its numeric value (for example, to look up a result on a table), the expected value isn’t worth much.
There is a large category of games where expected value is extremely important: casino games.
EXAMPLE: SIMPLE GAMBLING GAME
If we play a game where you roll a d6 and receive $1 for each pip you roll, each instance of that game would an expected value of $3.50. I’d be a fool to play that game with you, so instead I offer to play if you’ll wager $4 for each game. Now each game has, for you, an expected value of -$0.50.
For a fair game, I could charge you $7 to roll two dice. The expected value of 2d6 is 2 x 3.5, or 7, so with a cost of $7 and an expected value of 7, this game has a total expected value of zero for both of us.
Real casino games usually have a slight edge for the casino, often comparable to a $0.50 profit on a $4 bet. Here’s an example showing how such an edge is defined.
EXAMPLE: THE FIELD BET IN CRAPS.
The field bet is a one-roll bet, meaning that you win or lose after just one roll. If the next roll is a total of 3, 4, 9, 10, or 11, you win 1x your bet. If the roll is 2 or 12, you win 2x. On any other result (5, 6, 7, 8) you lose. How good is this bet, and how do we express that formally?
First, let’s look at the bet’s expected value. There are 36 possible rolls of 2d6, with total values and odds listed on the chart below. The “Ways” column indicates the different number of ways to make a given total. For example, there are 6 ways to roll a total of 7 (as we discussed in Settlers of Catan).
The next column, “Pays,” indicates the value of the game to the player. Note that when you lose, the game has a value of 0 (you get no money back). When you win 1:1, the game has a value of 2, because you are claiming your original bet plus the house’s payoff. When you win 2:1, the game has a value of 3 bets, because you take back your own bet plus 2x from the house.
The final column, “Value,” is the product of Ways and Pays. This shows the total value for all versions of each result. In a sense, we are pretending to play each of the 36 possible games exactly once, and adding up the results. This is similar to taking the average of all possible die rolls on a d6, and averaging them to find the expected value of the roll. In this case, we see that after 36 games of the Field Bet, we have won 34 bets.
Each of these 36 games cost us one bet, so we have to compare the value of 34 with the total cost of 36. This gives the expected return of the game, which is 34/36, or about 94.4%. The “house advantage” is the rest of this money. The other 2/36, or about 5.55%, is retained by the casino.
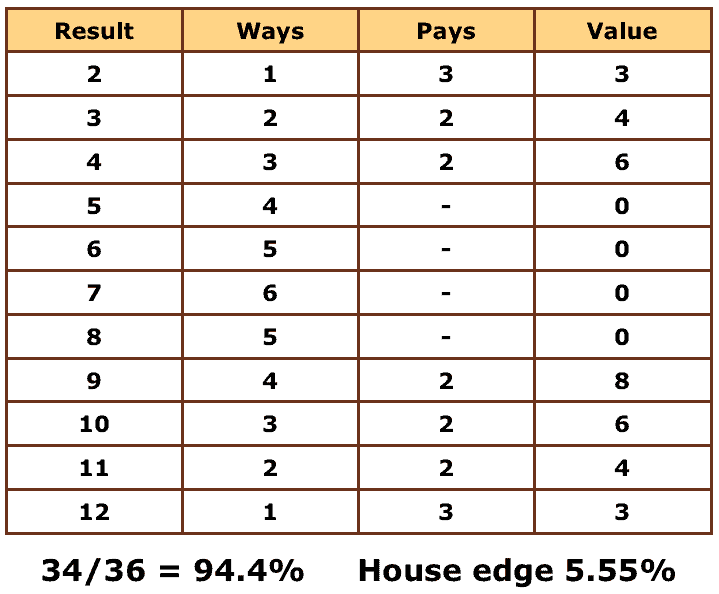
Luckily, most Field bets are better than this, and actually pay triple (not double) for a roll of 12. How does this affect the odds? The “Pays” and “Value” column now become 4 (3 bets paid plus 1 bet returned). The total value of the game becomes 35/36, and the house advantage is cut in half, from 2/36 to 1/36, or about 2.78%.
In the very rare case where the casino pays triple on both the 2 and the 12, the game is a perfectly fair bet, with 0% advantage for the house. This is actually not unheard-of, though 0% and player-advantage games are usually offered under conditions where players must play perfectly to take advantage of them, such as video poker.
As house edges go, 2.78% isn’t bad, though it’s not the best bet on the Craps table. House edges run anywhere from nearly zero on some Craps bets, to 5%-20% for other table games and slots, to as much as 35% for Keno.

THE GAMBLER’S FALLACY
One well-known misconception about random events is that their results tend to “even out” over time. For example, that after several “heads” results, “tails” becomes more likely. If the events are statistically independent, such as coin flips, this is not true.
And even if you don’t fall for that, you might still ascribe to the notion of adding more random events to a game to counteract the unfair effects of prior random events. This is a type of “comeback feature” intended to give hope to the players who fall behind early. However, that remedy doesn’t usually work. More decisions will certainly help, but not more random events. This is why the best purely random games are extremely short.
![]()
EXERCISE: RUNNING HOT
I just rolled a d6 five times, and it came up “6” every time. Is it more or less likely to roll a 6 on the next roll? Are 6’s “running hot” and I’m therefore more likely to get another, or have I “used them all up”?
Answer: Neither. This is not how dice work. The odds of rolling a 6 don’t change at all based on past history. Contrast this with a deck of cards, where previous draws will affect what’s left in the deck. The gambler’s fallacy is, in some sense, a notion that dice behave like cards.

EXPRESSING ODDS AS “X:Y”
Odds are often written X:Y, for example 3:1 (pronounced 3 to 1). This means the event will happen 3 times for every 1 time it doesn’t. (This is different from a bet paying 3:1, which means you will be paid 3 coins, plus your bet returned, on a winning bet of 1. The payouts in gambling games say little about their true odds.)
A simple example is this. Players are drawing for high card, but some players get to draw more cards than others. In a 2-player game where player 1 draws 2 cards and player 2 draws 5 cards, the odds of player 1 winning the game are 2:5. (And Player 2’s odds are the opposite, 5:2.)
To convert these expressions to percentages, you have to do a little juggling. 2:5 isn’t the same as 2/5. A probability of 2/5 means that the player wins 2 times in every 5 games. But a probability of 2:5 means that the player wins 2 games for every 5 losses. The difference is in the total number of games played. In the 2:5 instance, there are actually a total of 7 games (2 wins and 5 losses) so player 1’s odds are actually 2/7.
The conversion is simple. Just add both sides of the expression, which gives you the total number of games. Then divide the number of wins into that total number.
Often the odds in this format are written as “against” rather than “for” a win. For example, if the odds are 1:4 (20%) they can also be stated as 4:1 against. This means the odds of a loss are 4:1 or 80%.
![]()
EXERCISE: EXPRESS THE ODDS OF ROLLING A 7 ON 2D6 IN X:Y FORM.
There are 6 ways to roll a 7 out of a total of 36 rolls. This means there are 30 ways not to roll a 7. The odds are therefore 6:30, which reduces to 1:5.
![]()
EXERCISE FOR THE READER:
Convert the following X:Y expressions to percentages: 1:6, 2:3, 100:1
![]()
EXERCISE FOR THE READER:
Convert the following percentages to X:Y expressions: 15%, 25%, 99%

ADVICE FOR HOBBY GAME DESIGN:
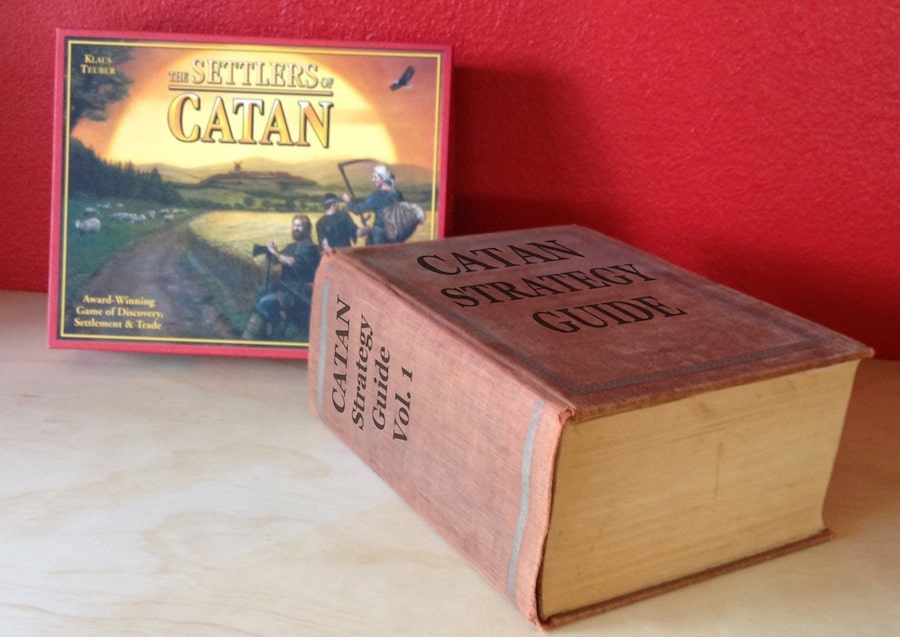
Typically, hobby games are too complex to be completely analyzed or solved. By comparison, the basic strategy table for Blackjack has approximately 500 decision points, and expands tenfold for anyone using a basic card counting technique. If you know the exact contents of the deck the table is even more complex, and Blackjack is a fairly short and simple game. A perfect strategy table for Settlers of Catan would look like an encyclopedia.
But even if completely analyzing your game design is out of the question, you can still use elements of probability theory to dissect segments of your game, and by doing so, get a better understanding of what events are likely, unlikely, and impossible.
We tend to use experimental and anecdotal evidence to decide whether random events are working or not. You can only playtest your game a limited number of times, but many of the random possibilities may be extremely rare. A practical analysis of the random events can give you a better understanding of whether your latest dice-rolling catastrophe was a fluke or a serious problem.
Players’ basic understanding of probability is usually fairly sound, though they don’t always have the language or the tools for analysis. So it’s important for the designer to explain the randomness as clearly as possible to help the players’ experience match up with their expectations. If some random challenge seems easy, but is really hard or impossible, the game is going to be frustrating. The opposite is also true: apparent long shots that always come in are also no fun.
It’s bad for the game if the random elements are hidden, overly complex, or poorly explained. Fun comes from a mix of surprise and understanding. Too much surprise, and the player can get frustrated. Too much understanding, and the player can get bored.
This means it’s better for players to think in terms of identifying and managing risks, rather than being randomly blown around by chance. That’s why the decisions have to be real and comprehensible. But that’s a topic for another time.

FURTHER READING
Articles in the “How To” section at cheapass.com, and eventually a game design book from James Ernest. Pester him frequently to make this happen.


