Now that we are moving toward getting Stones of Fate out to retail stores, one thing on my mind has been “How do I set the MSRP?” I am sure this is a question that comes up frequently with every publisher as they bring their games to market. I have heard the standard is 5 times the cost of printing and freight. That works ok and I don’t really have a problem with it. It makes it very easy, but I wonder if there is a way to determine if you are hitting the sweet spot in the market. What other factors go in to setting MSRP? What makes a potential buyer look at a game and say either, “That game is priced too high” or “That game is way under priced”?
SO I DECIDED TO FIND OUT.
Where to go? Why BGG of course! I did a survey of the BGG top 100, then threw in about 70 of 101-200 as well. Finally I added in about 30 of my own favorite games to bring the total games I analyzed to 200. As we go through this analysis, I will try to provide a frame of reference by tracking the following three games through the process:
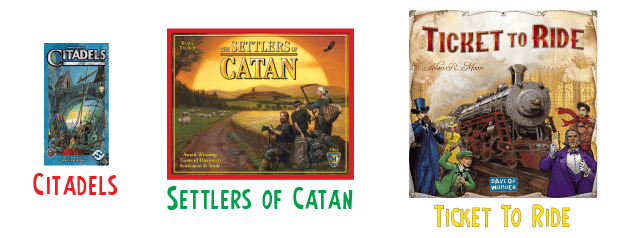
Since the standard is to set your price at 5 times the cost to print, I decided to start with component count. That most directly correlates with price to print. Note: I did decide to go with total component count over looking at various types of components that may or may not drive the price such as miniatures vs. wooden blocks, etc.
COMPONENT COUNT
I looked at the component count for each game and created a histogram showing the total number of games in the following groupings:
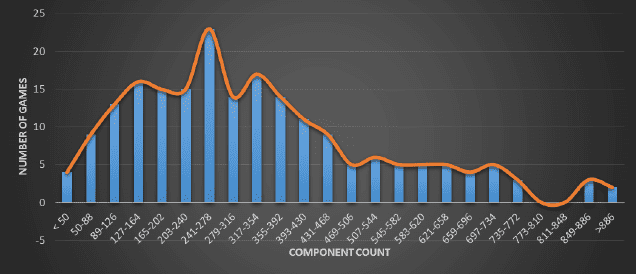
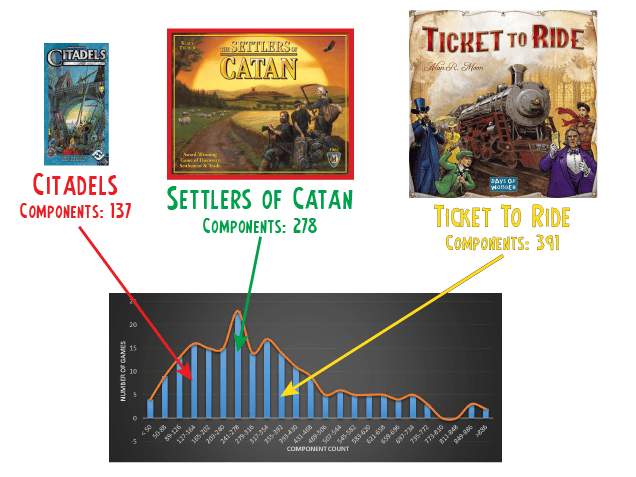
Unfortunately, I didn’t see a lot of patterns emerge. There was a spike at around 250 components, and it appears that about 3/4 of games have less than 470 components but other than that nothing popped out. This is where the reference games fit into the component histogram:
Maybe there is something else influencing the price of games. My next thought was box size. I know most boxes come in standard sizes. What if those sizes match up to various groups of MSRPs?
BOX SIZE
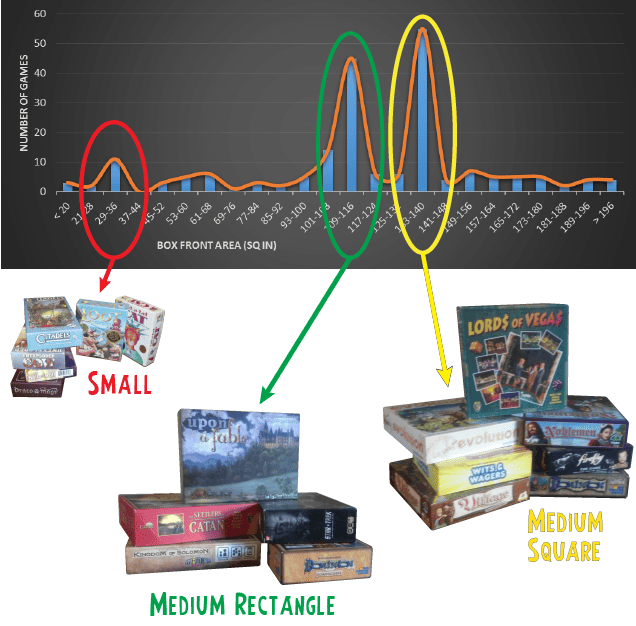
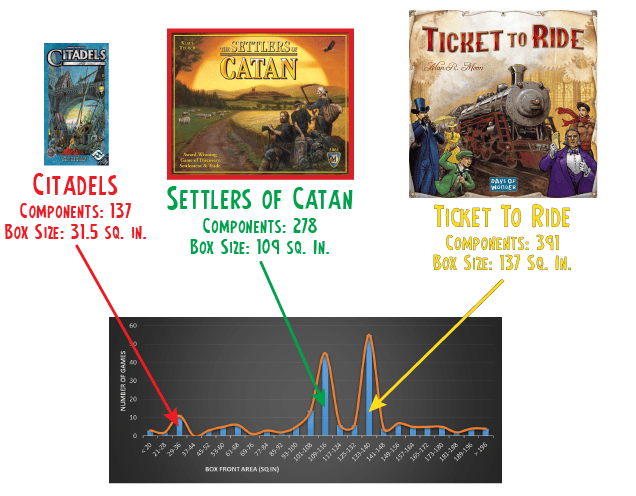
I created the same type of histogram with box size, looking at the surface area of all 200 games and the number of games in each of the following groupings:

I found that games come in basically 3 shapes/sizes. I called them the small box, the medium rectangle box, and the medium square box. The three reference games we are looking at fit perfectly into each of these three categories.
With significant patterns emerging with box size, I then looked at all the MSRP’s for the 200 games on my list. My hope was that they would map nicely into the 3 box size categories and I could just say that box size determines pricing.
MSRP
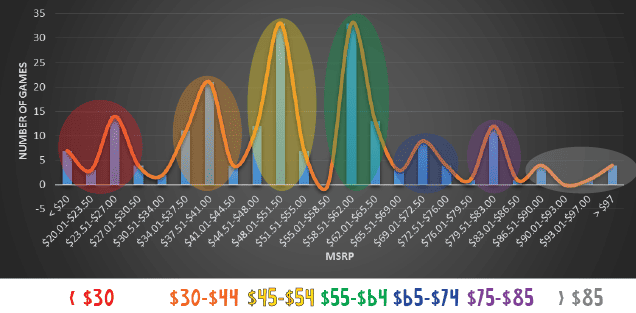
What I found was that prices for games fall into about 7 categories. So a nice finished piece with box size mapping perfectly into prices was not going to happen. And to continue our tracking of the three reference games, this is where they fall on the MSRP chart.
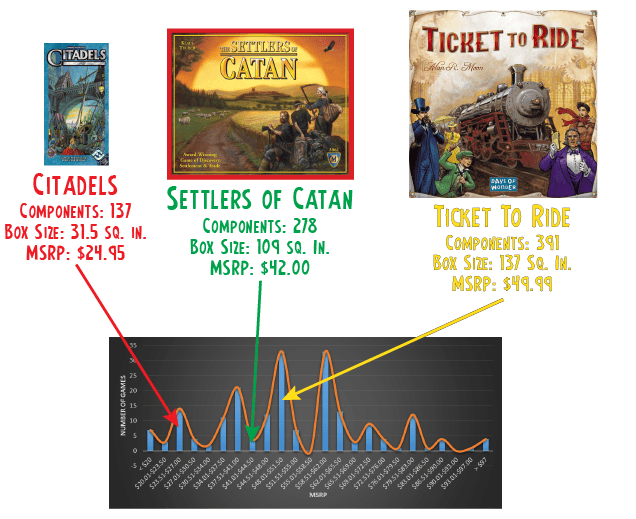
At this point it was back to the drawing board. I knew that price was influenced by both box size and component count via looking at the correlation coefficient for each when compared to MSRP (both had a fairly high correlation of 0.7). But was this a matter of the box size correlating with the component count? After all, more components generally means a bigger box. However, the correlation between box size and component count was only 0.5, so it appears that both factors weigh somewhat independently on pricing.
WHAT PRICE SHOULD MY GAME BE?
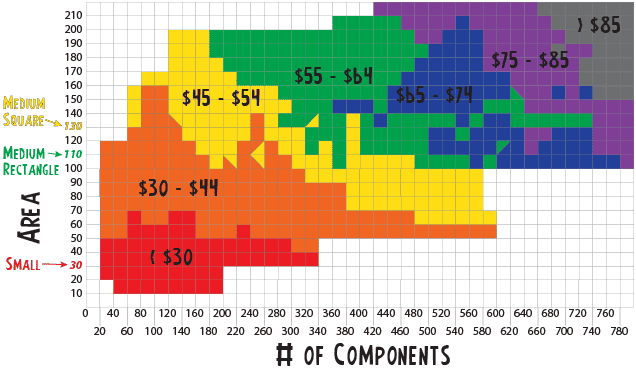
In order to look at both factors and how they influence pricing, I made the following chart. This chart allows you to look at the number of components of your game (x-axis) and the size of your box (y-axis) and then maps it into one of the 7 pricing categories that we talked about earlier. Note that this is not intended to be the final word on pricing, it is just a starting point derived from very preliminary research on the subject.
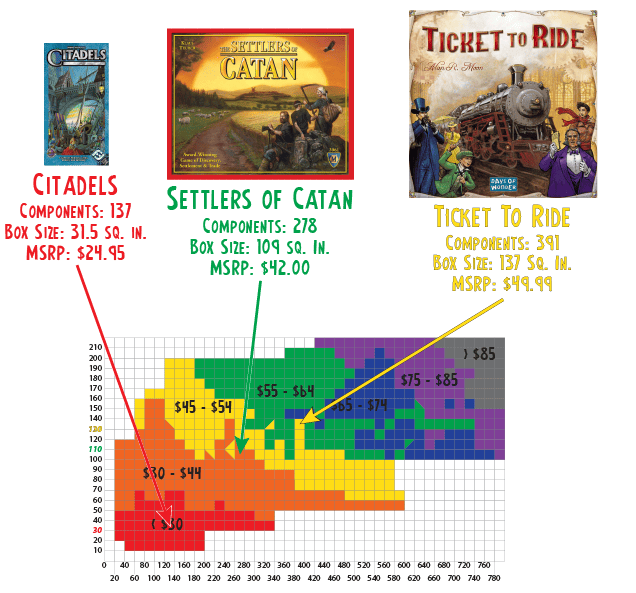
And where do our reference games fall on this chart? Well, exactly where you would expect given there box size and component count. Take a look below:
A couple more data points that can help in determining the price for your game is the price per component and price per square inch (surface area). The average price per component of all 200 games was $0.21. I took a look at how that compared to overall component count. Check out the following graph for the results.
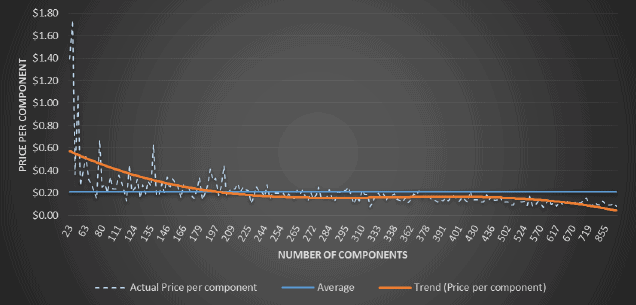
It’s interesting to see that for very low component count games the price per component is well above average. After you get to about 200 components, the price per component remains fairly steady at $0.18 till you get to 500 components at which point it starts to drop.
And, the graph for price per square inch related to surface area reveals some interesting trends as well.
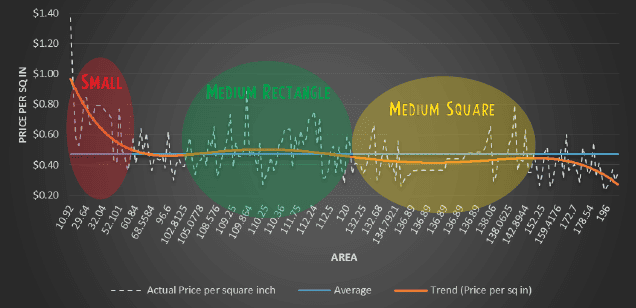
Like with the price per component graph, this one shows that for very low box size (i.e. the Small Box size) the price per square inch is significantly above average, running at about $0.70-$0.80 per square inch. The Medium Rectangle box also runs above average but only slightly (about $0.50 per square inch), and the Medium Square box runs slightly below average at about $0.40 per square inch.
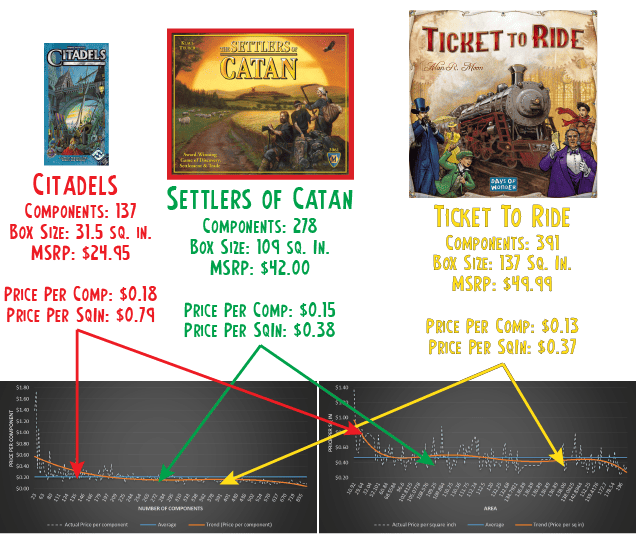
And finally, let’s look at how are reference games compare to averages in price per component and price per square inch.
A FEW MORE THINGS TO CONSIDER
TYPE OF COMPONENTS
If a significant number of your components are miniatures, or if your components are more expensive to produce for some other reason, you may be on the high end of your pricing range. Or your game may even belong in the next pricing tier even though its box size and component count put it in the one below.
PUBLIC PERCEPTION
Don’t underprice your game! I know we all want to provide a great price to the public, but there is a significant factor in how people perceive your game based on price. A price that is comparable to other items of the same size/shape will set the expectation. If it is significantly lower than similar items, it will be perceived as cheap or inferior quality and may not sell even with the low price.
ARTWORK
What does your game look like? Is it pleasing to the eye? A game that looks good will attract a customer and they will want to buy it. You can actually charge a little higher for a game with a very visually pleasing cover image. However, if your cover image is drab or dull, people’s eyes will pass right over it, and if they do pick it up are unlikely to want to pay a fair price for it.
Hopefully this will help you come up with a price for your game. Feel free to do your own game survey. Look at the games you own and see where they fall on the chart. Are they underpriced or overpriced? Maybe this chart will not only help you price a game but help you know if you are getting a good deal when you buy games as well.


